Capabilities How it works Forecasting Results Book a demo
Business Intelligence for Growing Companies

Years of data
in your books.
Zero insight from it.

We built QuoVio AI for businesses that have years of transactional data in their accounting system but no way to get real insight out of it — no analyst, no data warehouse, no BI tool. We connect to what you already have and give you intelligence you can actually act on.

Platform Capabilities

Your accounting system has the answers. We read them.

Every feature is built around one reality: your business data already exists. It just lives in a system that was built to record transactions, not surface intelligence. QuoVio bridges that gap — without a data team, a warehouse, or a six-month build.

Works with what you already use
Designed for Xero, MYOB, and QuickBooks. Export your standard transactional reports from your accounting system and upload directly to QuoVio — no new software to learn, no IT involvement, no complex setup required.
Xero
Processed
MYOB
Processed
QuickBooks
Processed
Insight without an analyst
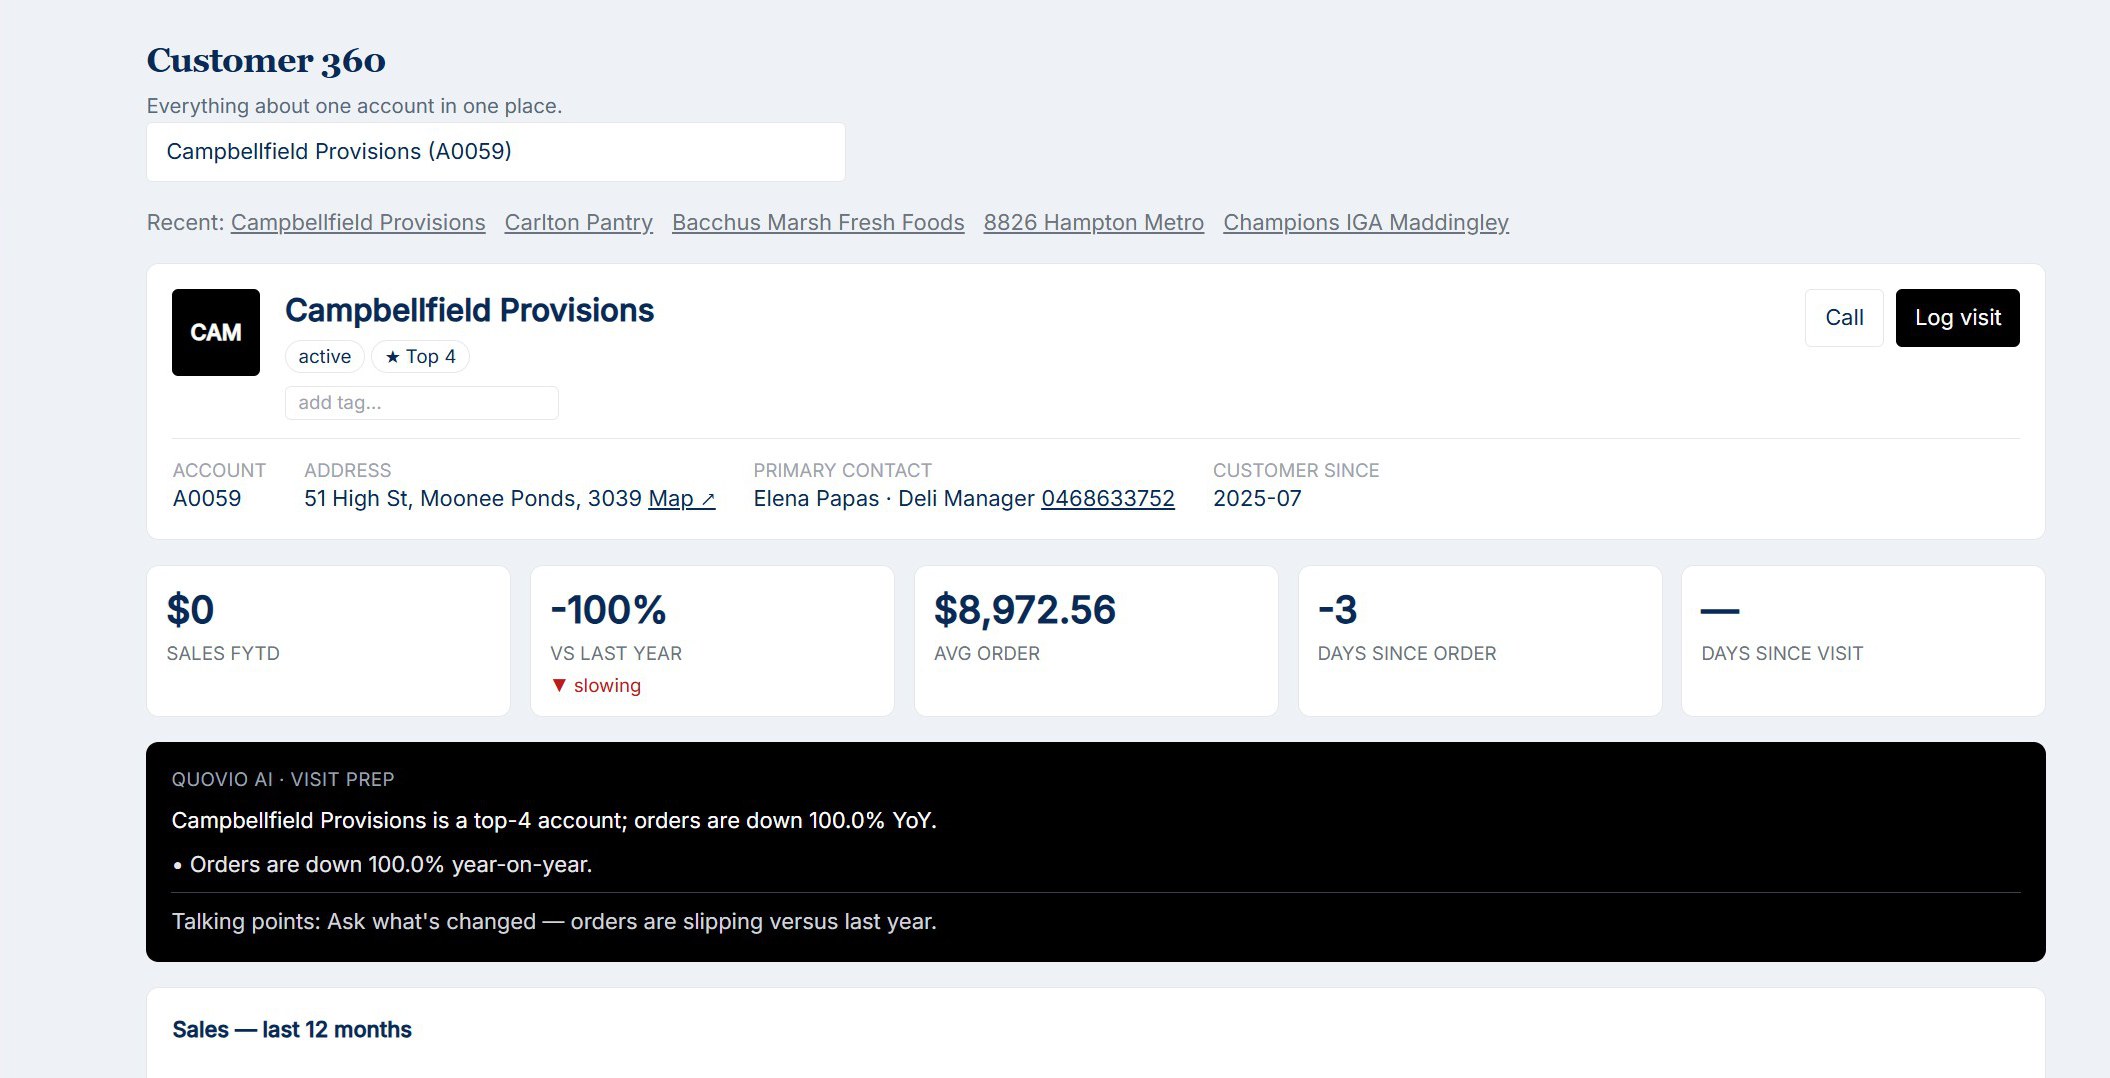
QuoVio surfaces what your accounting data is actually telling you — margin compression, customer concentration risk, revenue anomalies — before you have to go looking for it.
"Your top 3 customers represent 61% of revenue. Concentration has increased 14pts in 12 months — a risk worth addressing before your next planning cycle."
Product & Customer Profitability
Drill from total revenue down to contribution margin per product, per customer, per channel — without a single spreadsheet formula or pivot table.
Reports that write themselves
Weekly performance digests and board-ready summaries generated automatically. Share-ready PowerPoint reports built in one click — perfect for sales reviews or sharing with retail partners. No manual collation, no chasing numbers.
Trend & Anomaly Detection
QuoVio flags when something has changed — a customer buying less, a margin shifting, a cost creeping up — before it shows up in your end-of-quarter numbers.
The Process

From your data export to insight in three steps.

No complex setup. No data team. Run your standard reports, upload your data, and QuoVio structures your full history and surfaces intelligence — automatically.

01
Export from your accounting system
Run your standard transactional reports in Xero, MYOB, or QuickBooks and download the Excel file. No special configuration required — if you can export a report, you can use QuoVio.
02
Upload to QuoVio
Drag and drop your file into the QuoVio dashboard. Your data is ingested, a structured database is built, and your full transactional history is normalised — all in seconds.
03
Intelligence surfaces immediately
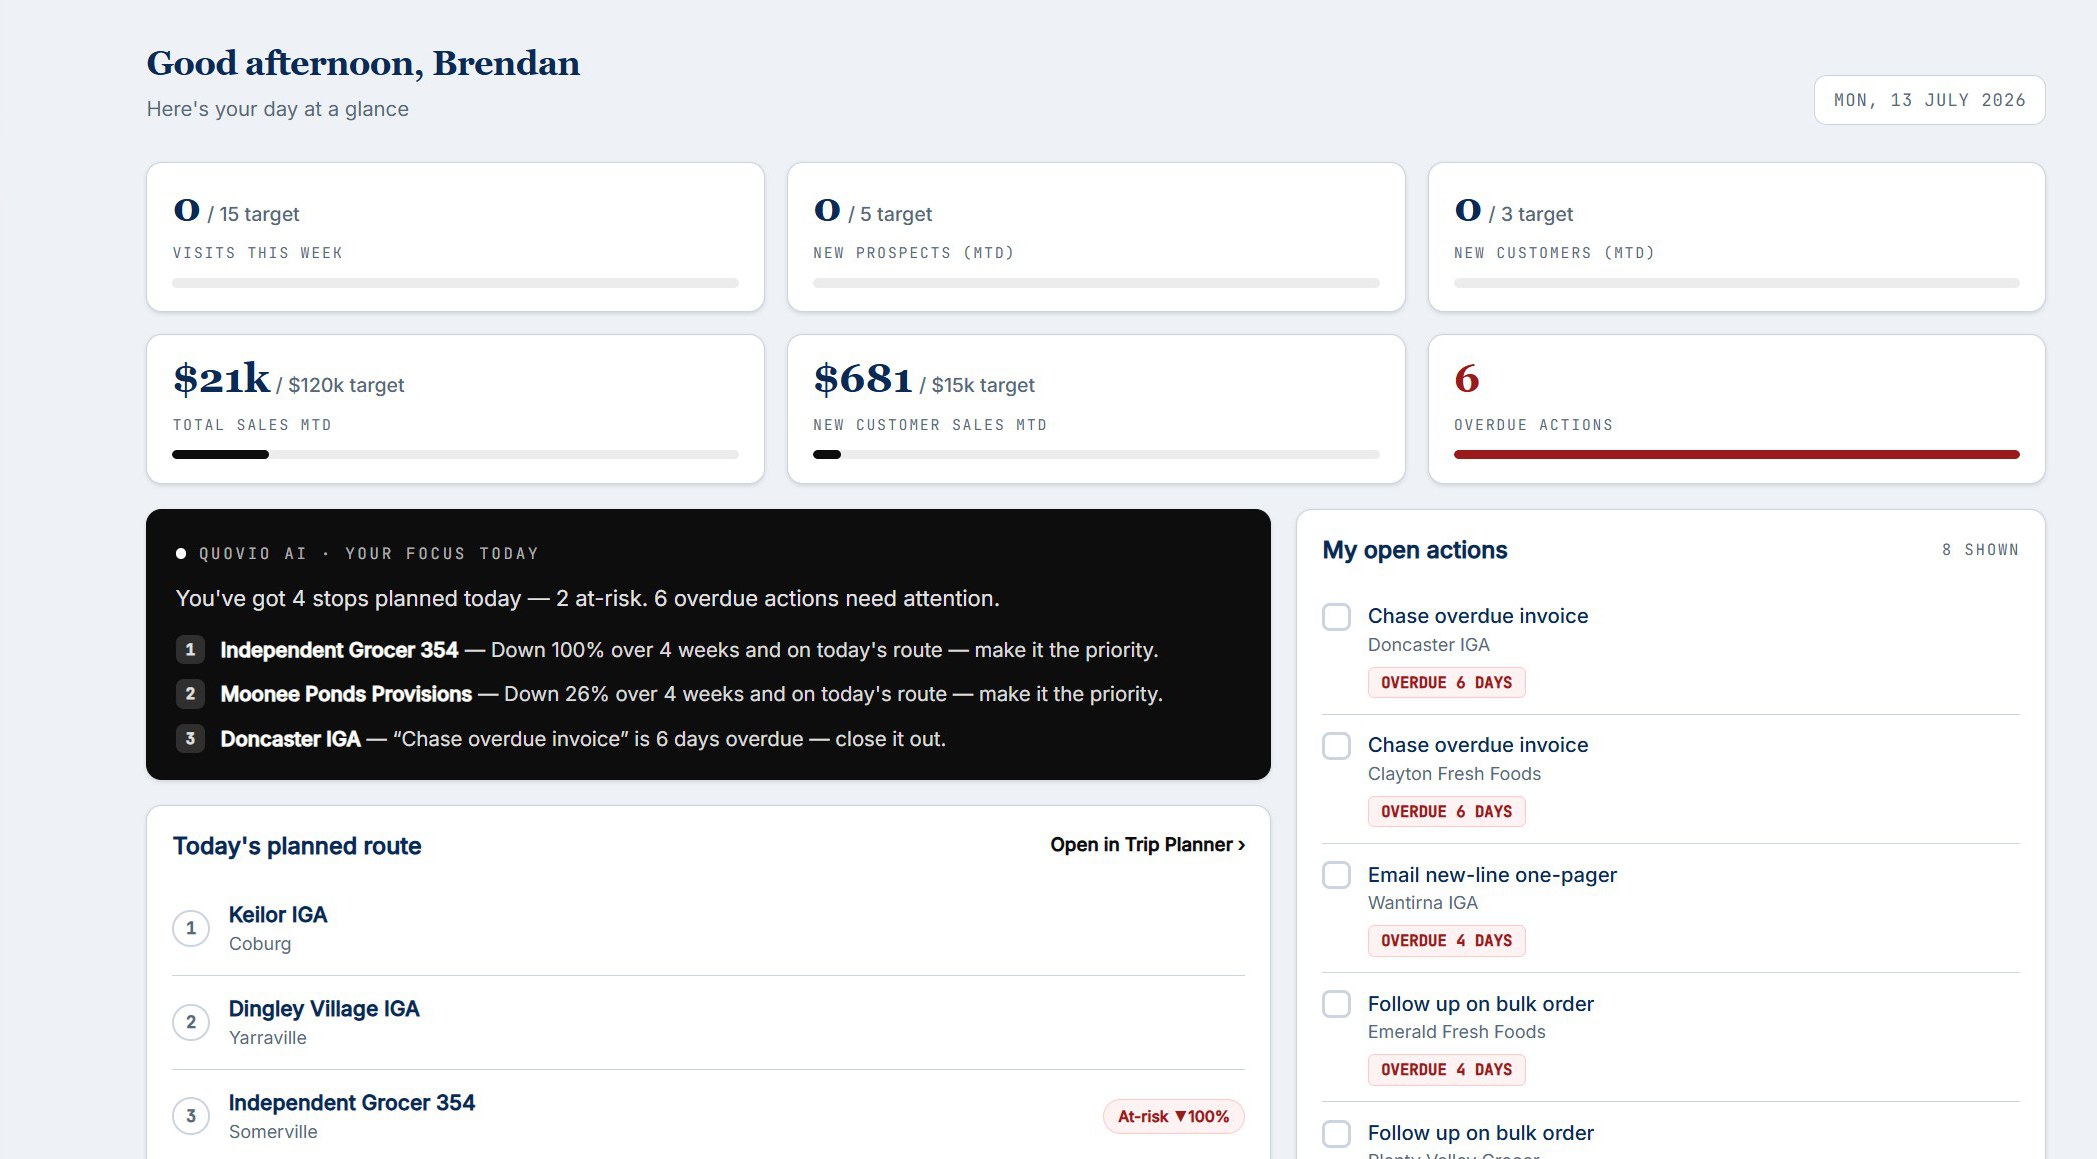
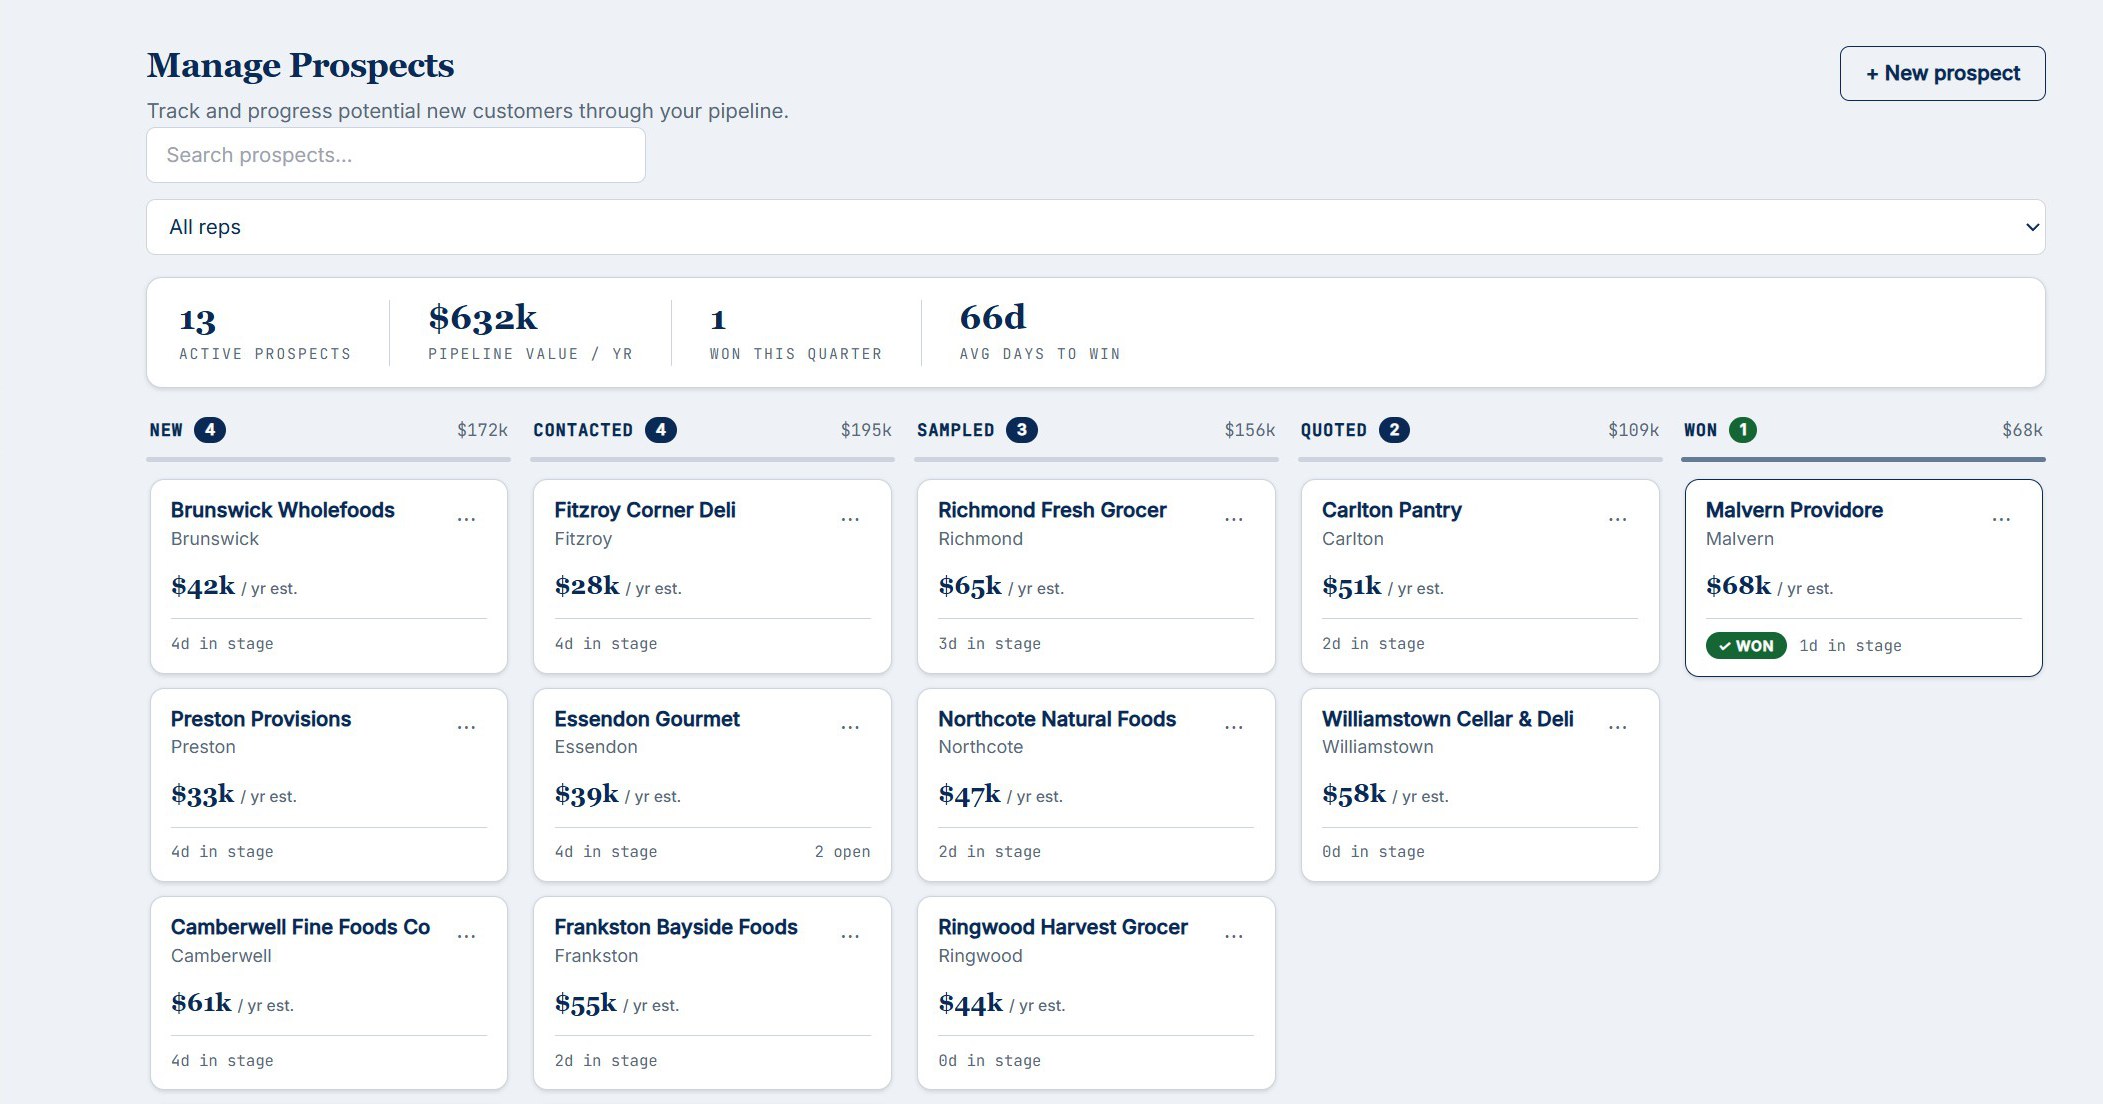
Visual reports on trends, customer and product performance, and week-on-week movements appear automatically — built to your requirements. Ask plain-English questions to get specific answers about your data.
04
Make faster, better decisions
Act on clear, AI-generated recommendations — not raw data. Share dashboards with your team, export reports, or generate PowerPoint decks ready to share in one click.
Live Insights — this week
Gross margin down 2.8pts in 8 weeks — cost of goods rising faster than price adjustments. Pricing review recommended before next quarter.
Customer concentration risk rising — top 4 accounts now represent 58% of revenue, up from 44% a year ago.
Revenue up 14.2% YoY but operating profit flat — growth is not translating. Overhead cost structure needs review.
3 customers inactive 90+ days — combined historic value $147k. Worth a direct outreach before they're gone for good.
Measured Outcomes

What changes when you can actually read your data.

0%
Average reduction in time spent on weekly reporting
0x
Faster identification of underperforming channels
$0M+
In margin opportunities identified across our customer base
0d
Median time to first actionable insight from sign-up
Intelligence Engine

A forecasting model built for the way real businesses operate.

QuoVio doesn't use simple year-on-year comparisons. The forecasting engine layers trend analysis, seasonality, and statistical confidence into every projection — so you know exactly which numbers to act on.

01
Data Evaluation
A rolling 12-month history is divided into up to 26 equal time buckets, matching your forecast window length. This gives the model a rich and proportionate view of how demand has evolved over time — far more signal than a simple snapshot.
Up to 26 time buckets
02
Linear Regression
Linear regression is run across all time buckets to identify the true underlying trend rate for each product — smoothing out one-off spikes and delivering far more predictive power than a simple year-on-year comparison.
Trend rate per product
03
Seasonality Layer
Seasonality is layered on top by comparing the same forecast window across prior years. A blending mechanism prevents the seasonal factor from over-amplifying or suppressing the trend when the two signals conflict.
Prior-year blending
04
R² Confidence Score
Each product carries an R² confidence score — a statistical measure of how consistently the trend fits the historical data. Planners instantly know which numbers to act on and which warrant a closer look before committing.
Statistical confidence per SKU
Get Started

Know where you stand.
See where you're going.

Book a 30-minute call. Upload your first data export and we'll show you what QuoVio surfaces from your own data — before you commit to anything.